P-v diagrams#
Tasks:#
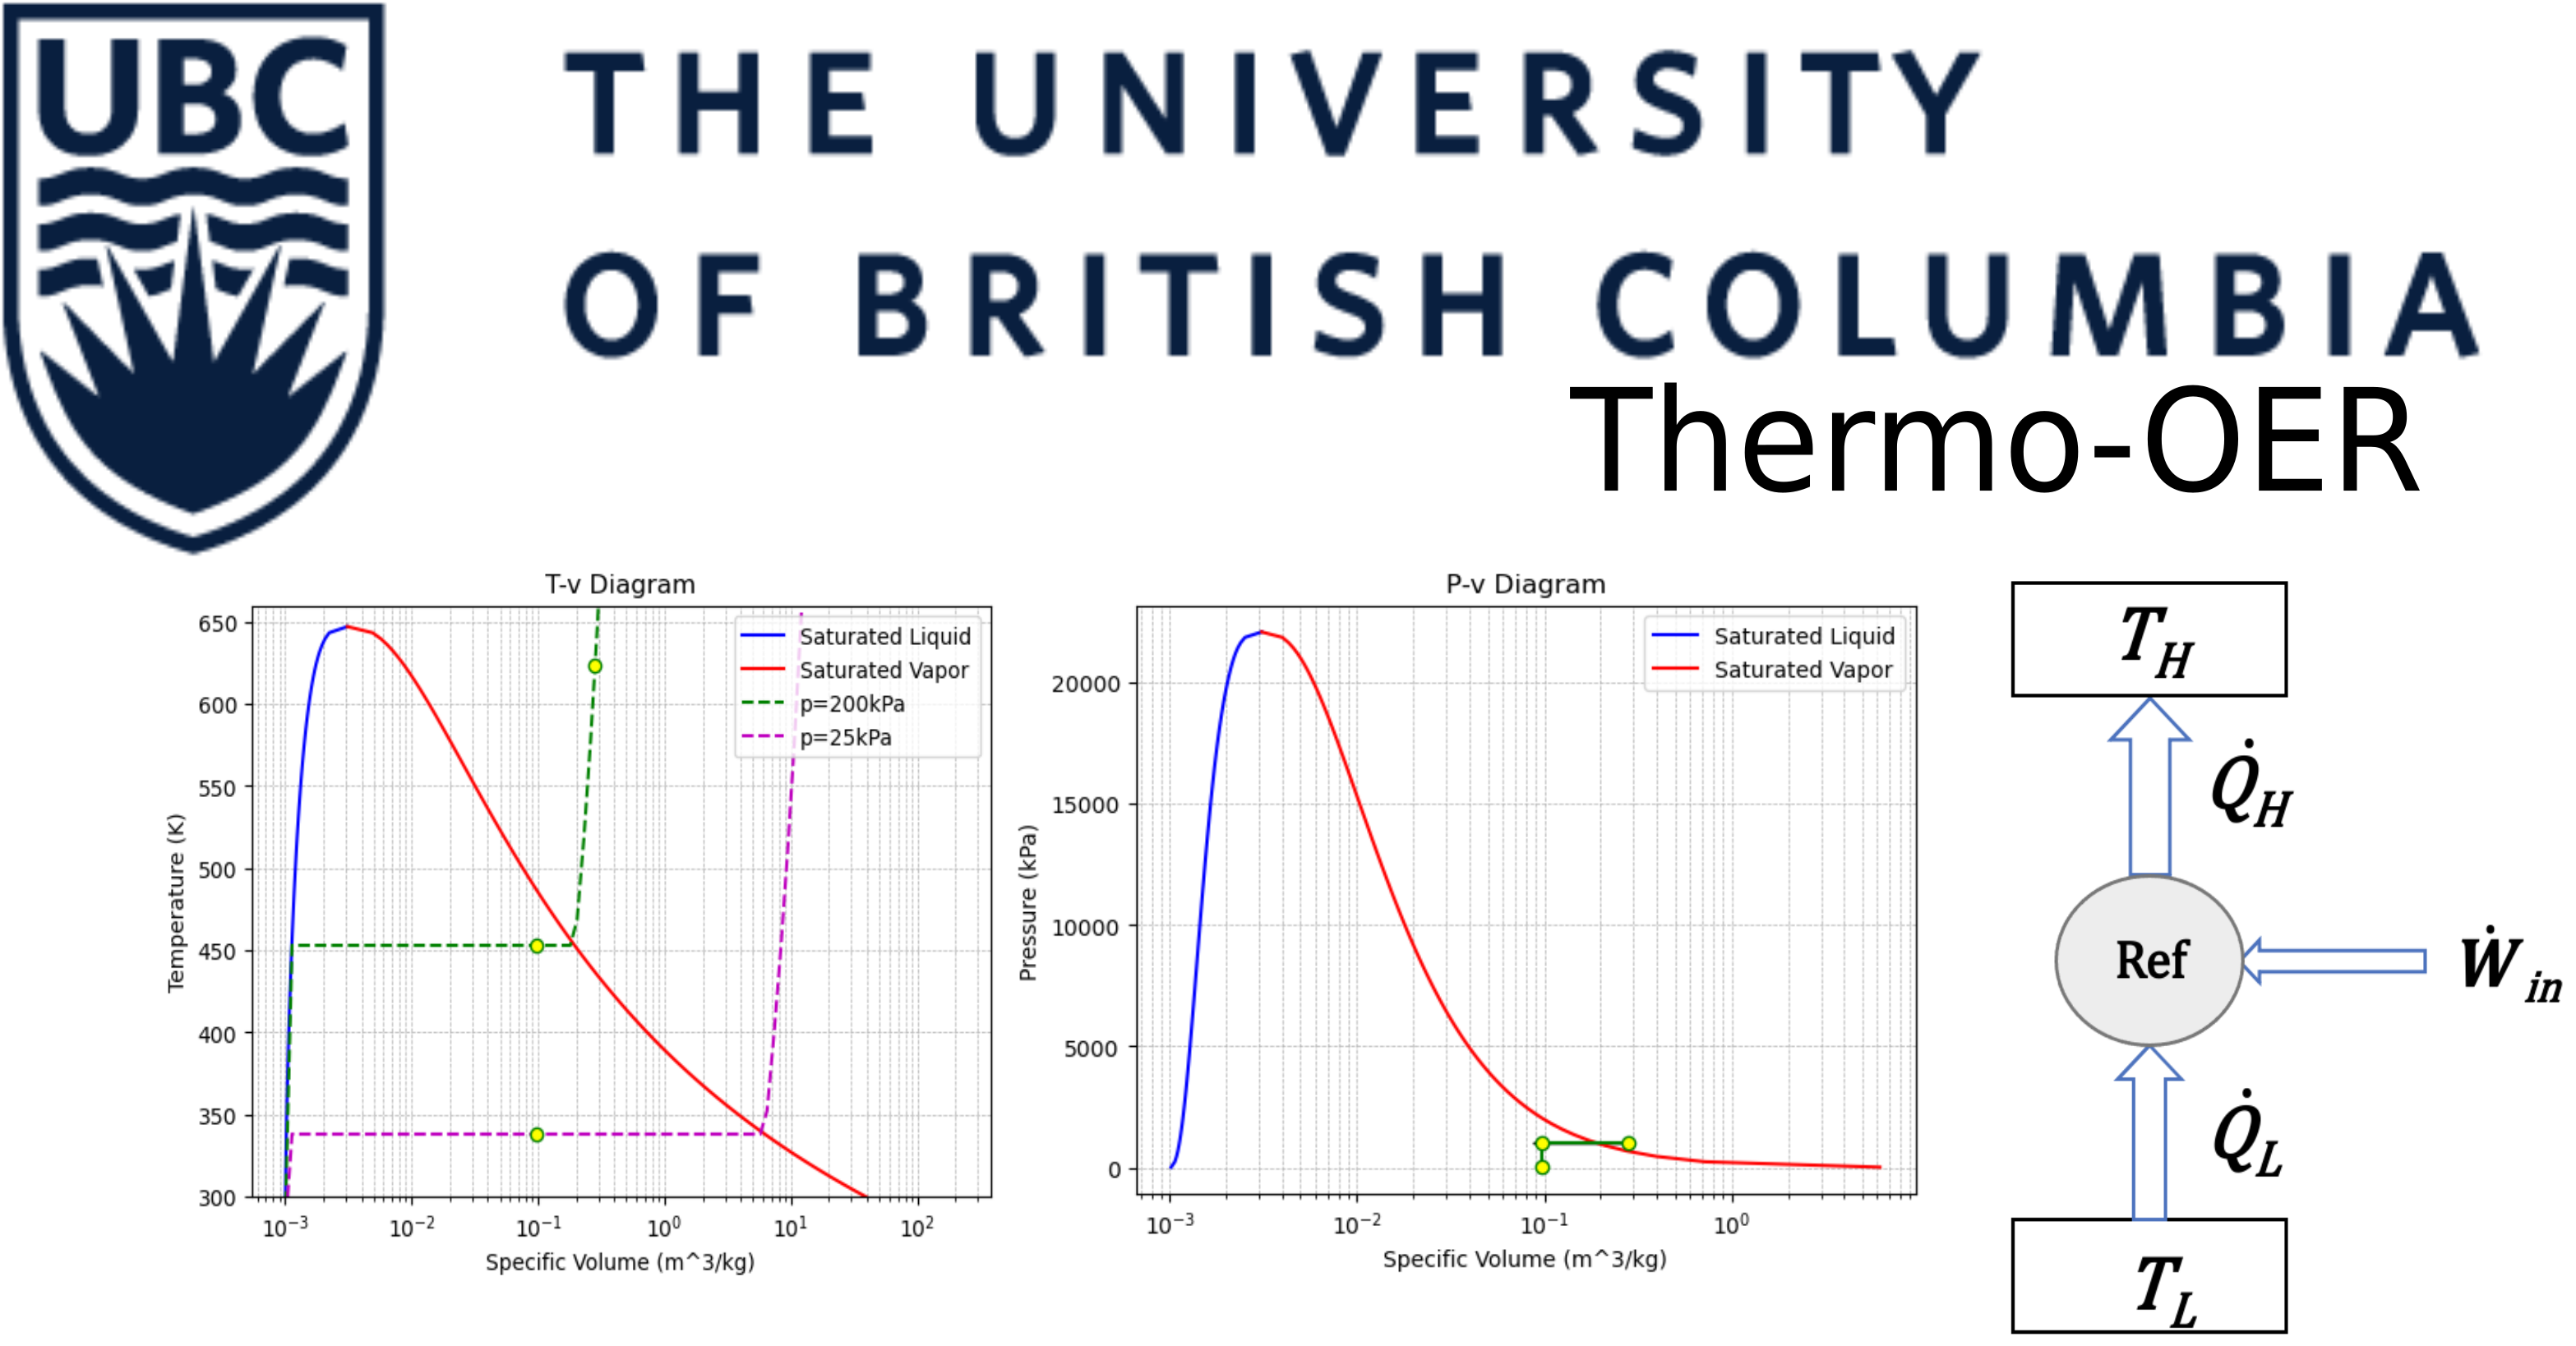
Zoom in and use the cursor to inspect the values of x and y-axes.
Inspect the critical values of the diagrams below for the three fluids
from IPython.display import IFrame

# Example to display the Water p-v diagram
display(IFrame(src='Water_p_v_plot.html', width=700, height=500))
# Repeat for Ammonia and R134a
display(IFrame(src='Ammonia_p_v_plot.html', width=700, height=500))
display(IFrame(src='R134a_p_v_plot.html', width=700, height=500))