4.12: P-v diagram for Polytropic air#
Problem Statement:#
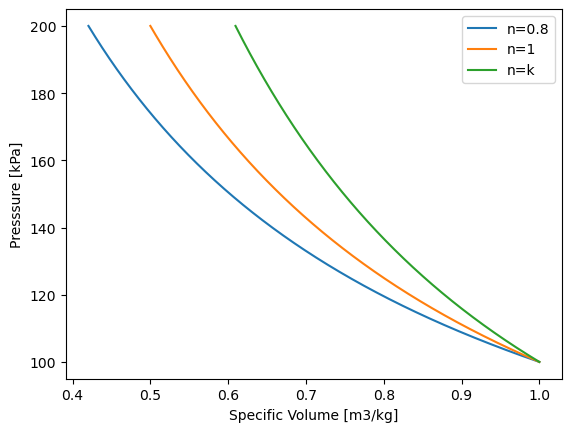
Consider \(1\:kg\) of air at a pressure of \(P=100\:kPa\) stored in a space with a volume of \(V=1\:m^3\). Sketch the P-v diagram for air going through a polytropic compression to double its pressure with three different n’s:
a) \(n=1\)
b) \(n=0.8\)
c) \(n=k=C_p/C_v\)
Solution Strategy:#
for a polytropic process
\(Pv^n=constant\)
therefore
\(v_2/v_1=(P_1/P_2)^{(1/n)}\)
and
\(v_2=v_1\times (P_1/P_2)^{(1/n)}\)
and to plot for specific volume
\(v=V/m\)
#import the libraries we'll need
import numpy as np
import matplotlib.pyplot as plt

#fluid properties
C_p = 1.005   #air Cp in kJ/kg.K
C_v = 0.718   #air Cv in kJ/kg.K

m = 1   #air mass in kg
V_1 = 1   #initial air volume in m3
v_1 = m / V_1   #initial air specific volume in n3/kg

P_1 = 100   #initial air pressure in kPa
P_2 = 2 * P_1   #final air pressure in kPa

P_vals = np.linspace(P_1, P_2, 1000)  # define an array of values for pressure (P)

#for n=0.8
n = 0.8   #polytropic constant
v_vals_a = v_1 * (P_1 / P_vals) ** (1 / n)

#for n=1
n = 1   #polytropic constant
v_vals_b = v_1 * (P_1 / P_vals) ** (1 / n)

#for n=k
n = C_p / C_v   #polytropic constant
v_vals_c = v_1 * (P_1 / P_vals) ** (1 / n)

##plotting P-v

plt.plot(v_vals_a, P_vals,label='n=0.8')  # plot pressure vs. specific volume
plt.plot(v_vals_b, P_vals,label='n=1')
plt.plot(v_vals_c, P_vals,label='n=k')
plt.legend()

plt.ylabel("Presssure [kPa]")  # give y axis a label
plt.xlabel("Specific Volume [m3/kg]")  # give x axis a label
Text(0.5, 0, 'Specific Volume [m3/kg]')