4.10: Comparison of work done in different processes#
Problem Statement#
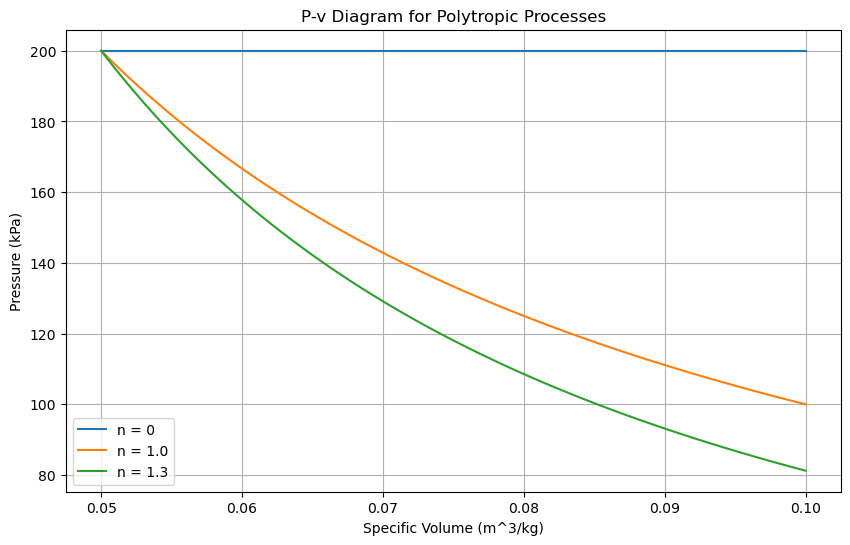
Consider an ideal gas undergoing a polytropic process. At the initial state, the pressure (P_1 = 200 kPa) and specific volume (v\(_1\) = 0.05 m\(^{3}\)/kg). At the final state, the specific volume (v\(_2\) = 0.1 m\(^3\)/kg). Analyze the process for polytropic exponents (n = 1.3) and (n = 1.0) (isothermal process).
Sketch the two processes on a P-v diagram. Which process has a larger specific boundary work?
Calculate the specific boundary work for both processes.
Compare the work for an isobaric (n=0), n=1 (isothermal), and n=1.3 polytropic processes.
Solution#
import matplotlib.pyplot as plt
import numpy as np
# Given values
P1 = 200  # kPa
v1 = 0.05  # m^3/kg
v2 = 0.1  # m^3/kg
n_values = [0, 1.0, 1.3]  # Polytropic exponents

def polytropic_process(P1, v1, v2, n):
    if n == 0:  # Isobaric
        P2 = P1
    else:  # Polytropic or Isothermal
        P2 = P1 * (v1 / v2)**n
    return P2

def specific_work(P1, v1, v2, n):
    if n == 0:  # Isobaric
        return P1 * (v2 - v1)
    elif n == 1:  # Isothermal
        return P1 * v1 * np.log(v2 / v1)
    else:  # Polytropic
        return (P1 * v1 - polytropic_process(P1, v1, v2, n) * v2) / (1 - n)

# Plotting the P-v diagram
plt.figure(figsize=(10, 6))
v = np.linspace(v1, v2, 100)
for n in n_values:
    P = [polytropic_process(P1, v1, vi, n) for vi in v]
    plt.plot(v, P, label=f'n = {n}')
    work = specific_work(P1, v1, v2, n)
    print(f'Specific boundary work for n = {n}: {work:.1f} kJ/kg')

plt.xlabel('Specific Volume (m^3/kg)')
plt.ylabel('Pressure (kPa)')
plt.title('P-v Diagram for Polytropic Processes')
plt.legend()
plt.grid(True)
plt.show()
Specific boundary work for n = 0: 10.0 kJ/kg
Specific boundary work for n = 1.0: 6.9 kJ/kg
Specific boundary work for n = 1.3: -6.3 kJ/kg