
3.5 Lee - Kesler Compressibility factor#
The following reference is the paper upon which the Lee-Kesler compressibility factor is generated.
Reference for Lee-Kesler compressibility factor
a)Try to reproduce a python code to regenerate the compressibility factor curve based on reduced pressure (\(P_r\)) for reduced temperature (\(T_r\)) equal to \(1.5\).
b) Calculate the compressibility factor for \(T_r = 1.5\) and \(P_r = 3\)
#importing required library
import numpy as np
import matplotlib.pyplot as plt

#introducing P_r and T_r
T_r = 1.5

#introducing constants
b1 = 0.1181193
b2 = 0.265728
b3 = 0.154790
b4 = 0.030323
c1 = 0.0236744
c2 = 0.0186984
c3 = 0
c4 = 0.042724
d1 = 0.155488E-4
d2 = 0.623689E-4
betha = 0.65392
gamma = 0.060167

B = b1 - b2/T_r - b3/T_r**2 - b4/T_r**3
C = c1 - c2/T_r + c3/T_r**3
D = d1 + d2/T_r

#V_r in an array structure
# an array of V_r is to be built so that Z is calculated based upon. Otherwise, the equation can't be solved analytically for V_r
V_r = np.logspace(-0.9, 1.65, 10000)
Z_array = 1 + B/V_r + C/V_r**2 + D/V_r**5 + c4*(betha + gamma/V_r**2)*np.exp(-gamma/V_r**2)/(T_r**3 * V_r**2) #Lee-Kesler equation
P_r_array = Z_array * T_r / V_r #calculating P_r based on the array built for V_r

#Plotting
plt.plot(P_r_array,Z_array)
plt.xlim(0.1, 10)
plt.ylim(0.2, 1.2)
plt.xscale('log')
plt.grid(ls='--')
plt.xlabel('Reduced Pressure Pr')
plt.ylabel('Compressibility Factor Z')
Text(0, 0.5, 'Compressibility Factor Z')
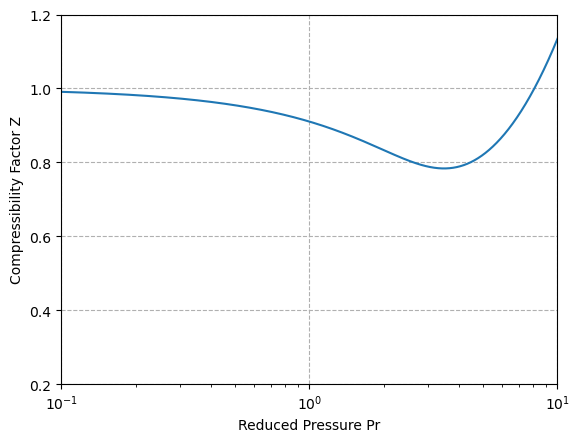
P_r = 3

#finding the index of the array element in P_r_array which is closest to the desired P_r value
difference_array = np.absolute(P_r_array-P_r)
index = difference_array.argmin()
Z = Z_array[index]
print('The compressibility factor value for P_r =',P_r, 'and T_r =', T_r, 'is', f"{Z:.3f}")
The compressibility factor value for P_r = 3 and T_r = 1.5 is 0.789